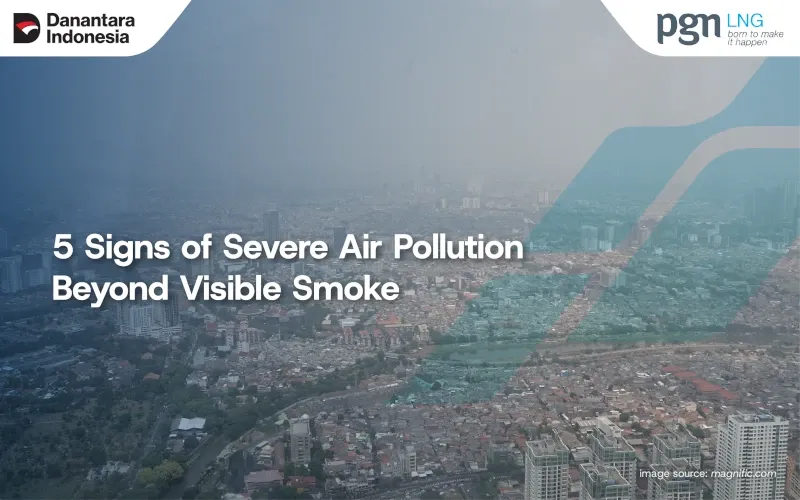
Industrial activities and power plants can produce air emissions, especially from the combustion of fossil fuels. Smoke from a stack is one of the easiest signs of pollution to recognize because it contains visible particles.
However, clear air is not always free of pollutants, because several gaseous pollutants, such as carbon monoxide (CO), nitrogen dioxide (NO₂), and sulfur dioxide (SO₂), cannot be seen directly. For this reason, visual observation alone is not enough to assess air quality.
What Are the Signs That Air Pollution Is Becoming Critical?
Air pollution is not always easy to recognize from the visible condition of the environment alone. To judge whether air quality is getting worse, there are several indicators that can be observed or measured.
1. Visible Smoke or Emissions Appear
Smoke from the stacks of power plants, boilers, or industrial facilities is one of the most recognizable signs of air pollution. However, denser smoke does not always mean a higher level of pollution, because the appearance of a plume is also affected by the characteristics of the particulates.
Conversely, the absence of smoke does not mean emissions are free of pollutants, because many gaseous pollutants are invisible and can only be identified through measurement.
2. PM2.5 and PM10 Concentrations Rise
Particulate matter (PM) refers to solid or liquid particles suspended in the air. PM10 has an aerodynamic diameter of up to 10 micrometers, while PM2.5 is up to 2.5 micrometers. Because of its smaller size, PM2.5 is hard to see even when its concentration rises.
PM2.5 and PM10 are key parameters in air quality monitoring because exposure is linked to health problems, particularly in the respiratory and cardiovascular systems. Particulates can come from fuel combustion, industrial activity, and transportation.
3. Concentrations of Gaseous Pollutants Rise
Air pollution can also occur when concentrations of gaseous pollutants rise even though the air looks clear.
Air pollution does not always produce smoke, because some pollutants are gases that cannot be seen, such as nitrogen dioxide (NO₂), sulfur dioxide (SO₂), and carbon monoxide (CO).
The concentrations of these three gases cannot be judged by visual observation alone, so measurement is needed to determine their levels in the air. The results are then compared with the applicable standards to determine whether pollutant concentrations have exceeded the set limits.
4. The Air Quality Index Shows Unhealthy Air Quality
Indonesia’s Air Pollution Standard Index (Indeks Standar Pencemar Udara, or ISPU) is an indicator that helps people understand ambient air quality based on the concentrations of several pollutant parameters: PM10, PM2.5, SO₂, CO, O₃, NO₂, and hydrocarbons (HC).
The higher the ISPU value, the worse the air quality category:
- 101–199: unhealthy.
- 200–299: very unhealthy.
- Above 300: hazardous.
These categories indicate that exposure to pollutants calls for greater attention. However, the ISPU value only describes ambient air quality at the monitoring location, not the amount of emissions released by industrial activities.
5. Pollutant Concentrations Exceed Ambient Air Quality Standards
The Ambient Air Quality Standard is the limit on pollutant concentrations in outdoor air set by regulation.
Under Appendix VII of Indonesia’s Government Regulation No. 22 of 2021, each type of pollutant has its own concentration limit and measurement period. Some examples include:
- PM2.5: a maximum of 55 µg/m³ for a 24-hour measurement and 15 µg/m³ for the annual average.
- PM10: a maximum of 75 µg/m³ for a 24-hour measurement and 40 µg/m³ for the annual average.
- SO₂: a maximum of 150 µg/m³ for a 1-hour measurement, 75 µg/m³ for 24 hours, and 45 µg/m³ for the annual average.
- NO₂: a maximum of 200 µg/m³ for a 1-hour measurement, 65 µg/m³ for 24 hours, and 50 µg/m³ for the annual average.
- CO: a maximum of 10,000 µg/m³ for a 1-hour measurement and 4,000 µg/m³ for 8 hours.
- O₃ (ozone): a maximum of 150 µg/m³ for a 1-hour measurement, 100 µg/m³ for 8 hours, and 35 µg/m³ for the annual average.
If measurement results exceed the applicable limits, air quality does not meet the standard. For a company, this is a reason to evaluate air quality around its operating area and trace possible sources of pollution.
Read More: The Most Harmful Effects of Air Pollution
Where Does Air Pollution Come From?
Air pollution can come from many activities, including industry, power generation, mining, transportation, and shipping.
At power plants, boilers, furnaces, and industrial engines, fuel combustion can produce pollutants such as particulates, nitrogen oxides (NOx), sulfur dioxide (SO₂), and carbon monoxide (CO).
Mining and mineral processing can generate dust or particulates, while vehicle and ship engines produce emissions from fuel combustion.
The type and amount of pollutants released are not always the same at every facility, even when the activities are similar. These differences are influenced by the type of fuel, combustion conditions, operating load, and the emission control systems in use.
Read More: Key Benefits of Alternative Energy Beyond Pollution
How Can Companies Monitor and Control Emissions?
Visual observation can serve as an initial check, but it is not enough to determine the amount and type of pollutants being released.
For this reason, companies need to measure emission parameters that match the characteristics of the source, such as particulates, nitrogen oxides (NOx), sulfur dioxide (SO₂), or carbon monoxide (CO).
The results are then compared with the standards and monitoring requirements that apply to that type of facility. In Indonesia, these references must be matched to the sector and emission source, because not every industry uses the same standards.
Monitoring results can help a company track changes in emissions and identify the parts of its operations that need to be evaluated. If emissions rise, a company can check combustion conditions, fuel efficiency, or the performance of its emission control equipment.
Control measures can include optimizing the combustion process, improving operational efficiency, adjusting fuel choices, and installing or upgrading emission control technology.
By relying on measurement results, companies can decide on corrective steps based on actual conditions, not just visual observation.
Read More: 5 Signs of Global Warming
Why Does Fuel Choice Matter in Emission Control?
Fuel is one of the factors that shapes the emission profile of combustion. The sulfur, carbon, and other elements in a fuel can influence the pollutants it produces.
For this reason, fuel evaluation is one aspect that companies with large energy needs should consider.
However, fuel type is not the only determinant of emissions. Combustion technology, equipment efficiency, operating conditions, and pollution control systems also play a role. Companies need to choose fuels that fit their energy needs and facility characteristics, while also considering supply reliability and emission management efforts.
How Can LNG Be an Emissions Solution?
Liquefied Natural Gas (LNG) can be one solution to help companies reduce emissions and air pollution from industrial activities, especially when it replaces coal or petroleum.
LNG produces far lower sulfur dioxide (SO₂) and particulate emissions than coal, because its sulfur content is very low and its combustion does not produce ash.
LNG also produces lower carbon dioxide (CO₂) emissions per unit of energy than coal. These characteristics make LNG a fuel option for industries that want to cut emissions from power generation and industrial activities.
For LNG to support emission reduction efforts, companies need to make sure that the gas supply and supporting infrastructure match their operational needs.
This includes supply availability, distribution to the industrial site, and storage and regasification facilities, so that LNG can be used as fuel for power generation and production processes.
PGN LNG Indonesia offers LNG solutions covering supply, storage, distribution, and regasification to support industrial energy needs. With these services, companies can consider LNG as an option for reducing emissions and as part of their energy transition strategy.
Want to learn more about how our LNG solutions can support your company’s energy needs? Find out more here: LNG Supplier in Indonesia.
References
- Audit Board of Indonesia (BPK). Accessed 2026. Government Regulation (PP) No. 22 of 2021
- Audit Board of Indonesia (BPK). Accessed 2026. Minister of Environment and Forestry Regulation No. 14 of 2020
- World Health Organization (WHO). Accessed 2026. WHO Global Air Quality Guidelines
- World Health Organization (WHO). Accessed 2026. Air quality, energy and health